


A website that allows to collect and visualise crowdsourced and previously hidden data about platforms.
Done as the Thesis for the Communication Design Master of Sciences at Politecnico di Milano, supervised by María de los Ángeles Briones, co-supervised by Matteo Azzi and Giorgio Uboldi.

Structure

The website's experience starts with a Landing Intro leading to the Home. From there, the user can choose between 5 different pages. The "Platform Overview", "Compare" and "Collaborate" pages and subpages constitute the core of the site's functionalities.

Data Visualisation
Different types of data visualisation are used for each group of data. When data is composed of various data points, the visualisation aims to provide a nuanced view, that is, showing each single data point as a composing part of a "bigger picture".

Cash Flow
Percentuals Received by Each Part in the Transaction (Bar Chart)


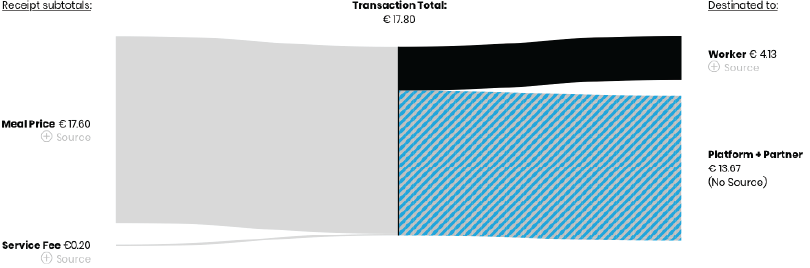
Cash Flow
How money is allocated within a transaction (Alluvial Diagram/Sankey)

People and Stats
Number of individuals taking part in the platform (Simplified Circle Packing)


Worker Remuneration
Amount earned per hour (Beeswarm)


Pages and Main Elements


User Scenarios

The confused consumer
A consumer realizes that dishes on restaurant cost the same as on the platform menu. This makes her think: “How platforms can make money? And what about those delivering the food?”. After some web searches she finds herself at Unveiling Platforms, where the answers to those questions can be found. Excited with the discovery, she tries comparing the platform with another one. After seeing that some data about a platform knows about is missing, she decides to collaborate.

Suspecting driver
A driver does not understand how he's being remunerated. He is recommended Unveiling Platforms by a friend and goes to upload his own remuneration there, willing to understand how it compares to other drivers in his area.

Angry passenger
A passenger that already knew Unveiling Platforms tells a driver she paid “a lot” for that ride as there was a price surge. The driver answers back saying he’s receiving the regular fare for the ride. She then screenshots her receipt and gets the screenshot of the driver’s remuneration for that ride. After leaving the car, she uploads the transaction to the website.

Thanks for watching!
Unveiling Platforms
Investigating and visualising lack of transparency and inequality in lean platforms
Guilherme Appolinário
Politecnico di Milano Laurea Magistrale – Communication Design
Supervisor: María de Los Ángeles Briones Rojas
Co-supervisors: Matteo Azzi, Giorgio Uboldi

Aknowledgement note by the author: for the Italian Ministry of Foreign Affairs and International Cooperation Invest Your Talent in Italy scholarship program I am thankful for this opportunity.


